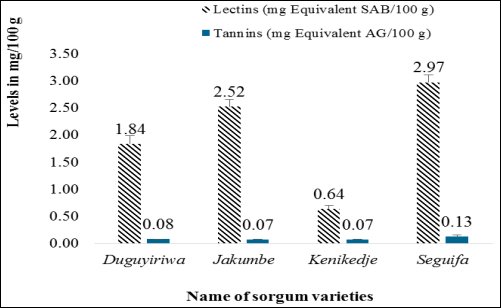
2. Materials and Methods
2.1. Plant Material
The grains of four varieties of sorghum,
Duguyiriwa,
Jakumbe,
Seguifa and
Kenikedje (
Table 1), were used as the plant material.
Table 1. Characteristics of sorghum varieties collected. Characteristics of sorghum varieties collected. Characteristics of sorghum varieties collected.
Name | Type | Adaptation zone | Rainfall isohyet (mm) | Plant height (m) | Release year | Cycle length to maturity (days) |
Duguyiriwa (016-SB-BC1F6-1090) | OPV | Sahelian | 400-800 | 2.15 | 2023 | 95 - 100 |
Jakumbe (CSM 63E) | OPV | Sahelian | 500 - 800 | 3 | 1984 | 100 |
Seguifa (Malisor 92-I) | Hybrid | Sahelian | 500 - 600 | 2 | 1995 | 100 |
Kenikedje (97-SB-F-5DT-64) | OPV | Sudanian | 600 - 800 | 2.5 | 2002 | 110 |
2.2. Methods
2.2.1. Physicochemical Characterization
(i). Physical Characterization
The physical characterization was carried out using the methods described in the literature
| [9] | Patekar S, More D, Hashmi S. Studies on physico-chemical properties and minerals content from different sorghum genotypes. J Pharmacogn Phytochem. 2017; 6(5): 600–4. |
[9]
. The color and shape of the grains were determined through visual inspection. Their dimensions were measured with a ruler graduated in mm. The gravimetric method, which uses an electric balance, was used to assess the weights of sorghum grains in batches of 1,000.
(ii). Chemical Characterization
Free acidity
A mass of 1 g of flour sample was dissolved in 10 mL of distilled water. A few drops of 1% alcoholic phenolphthalein solution were added. This solution was titrated with a 0.1 N sodium hydroxide (NaOH) solution until it turned pink
| [10] | Tounkara F, Amza T, Lagnika C, Le G wei, Shi Y hui. Extraction, characterization, nutritional and functional properties of Roselle (Hibiscus sabdariffa Linn) seed proteins. Songklanakarin Journal of Science & Technology. 2013; 35(2): 159–66. |
[10]
. Free acidity was expressed in milliequivalents per 100 g of sample (meq/100 g) and then translated into Dornic degree (°Dornic) using the respective equations below.
Freeacidity(meq/100g)=(N1x105)/mwhereN1=(1)
Freeacidity(°Dornic)=(2)
V1 = Volume of sample solution taken (mL);
V2 = Volume of NaOH added (mL);
N1 = Normality of sample solution taken;
N2 = Normality of NaOH (= 0.1);
m = mass of sample taken (g).
Moisture and dry matter
For the determination of moisture in cereals, oven-drying methods are obviously the first choice because of their speed and simplicity.
The moisture and dry matter contents were performed by differential weighing according to the literature
| [11] | Tounkara F, Togola I, Konaré MA, Fane MM. Identification of Antioxidative Peptides from Roselle (Hibiscus Sabdariffa Linn) Seeds Protein Hydrolysates. J Food Nutr Sci. 2022; 10(4): 98–105. https://doi.org/10.11648/j.jfns.20221004.11 |
[11]
. Ten grams (10 g) of sample powder was weighed in a crucible before and after drying in an oven at 105°C for 24 h. The dry matter and humidity contents were calculated based on the formula below.
Drymatter(%)=(3)
Moisture(%)=100-Drymatter(%)(4)
Total ashes
Incineration method was used to assess total ashes contents.
Five grams (5 g) of sample powder were introduced into a porcelain crucible, which was then placed inside an oven at 550°C ± 5°C for 4 hours. Total ashes levels were calculated according to the following equation
| [12] | Konare MA, Cisse C, Diarra N, Somda MK, Wele M, Sanogo R. Nutritional composition of four underexploited wild fruits in Mali. Food Nutr Sci. 2022; 13: 26–40. https://doi.org/10.4236/fns.2022.131004 |
[12]
.
Totalash(%)=(5)
2.2.2. Determination of Nutritional Characteristics
(i). Total Proteins and Amino Acid Profile
Total proteins
Total proteins were assayed using the Kjeldahl method
| [13] | AFNOR. Association Française de Normalisation, NF V03-050, 1970. Directives générales pour le dosage de l’azote avec minéralisation selon la méthode de Kjeldahl, 8p. 1970; |
[13]
. A mass of 0.2 g of powder was introduced into a flask containing 5 g of mixed catalyst and 10 mL of 0.1 N H
2SO
4. The contents were disaggregated on a Kjel-Digester (k-446) at 400°C for 15 min to mineralize and distilled within 4 min. The mineralized substrate was purified by distillation. After titration with H
2SO
4, the nitrogen (N) concentration was quantified using the equation below. The total protein content was then deduced from the nitrogen content using a conversion coefficient of 6.25.
(6)
V1: Volume of H2SO4
V2: Volume of blank
C: Concentration of H2SO4
Totalproteins(%)=Nitrogen(%)x6.25(7)
Amino acid profile
Thin layer chromatography (TLC) was used to identify the amino acid profiles of the samples. Approximately 10 µL of aqueous extract from each sample was deposited on a silica gel plate with a total migration distance of 10 cm. Available standard amino acids in the laboratory were also deposited. After approximately 5 min of air-drying, this plate was introduced into a glass migration vessel containing an eluent composed of butanol, acetic acid, and water (7–3–2; v/v/v). After approximately 2 h of migration, a 1% ninhydrin solution was used to reveal the spots, and retention factors were calculated according to the following formula
| [14] | Sanogo R, Aïssa Jazy M, Haïdara M. Chromatographie sur couche mince et activité antiradicalaire d’extraits de Pupalia lappacea (L.) Juss. Amaranthaceae. Eur Sci J. 2018; 14(3): 140–155. https://doi.org/10.19044/esj.2018.v14n3p140 |
[14]
. Amino acids contained in the samples were identified by comparing their retention factors to those of the available standard amino acids.
RetentionFactor=(8)
(ii). Fat Contents
The delipidation method was used to estimate fat contents
| [15] | Singh AK, Singh R, Chaudhary DR. Heat conduction and moisture migration in unsaturated soils under temperature gradients. Pramana J Phys. 1989; 587–94. https://doi.org/10.1007/BF02845809 |
[15]
. A test portion of 1 g of sample was introduced into 10 mL of hexane, and the mixture was centrifuged at 4000 RPM for 10 min. The supernatant was poured off, and the powder was taken up again in 10 mL of hexane. This operation was repeated three times, and the resulting delipidated powder was recovered on blotting paper. After air-drying for 30 min, the delipidated powder was reweighed, and the fat contents were deduced according to the following equation.
Fatcontents(%)=x100(9)
(iii). Carbohydrates and Starch
Total carbohydrates
The total carbohydrate contents were determined via the difference method as reported in the literature on the basis of the equation below
| [16] | Guindo F, Konaré MA, Daou C, Kouyaté AM. Influence des types de coupe sur les caractéristiques physico-chimiques et organoleptiques des feuilles de Baobab. Int J Progress Sci Technol. 2022; 34(2): 170. |
[16]
.
Carbohydrates(%)=100–[%Moisture+%Protein+%Fat+%Ash](10)
Total starch, amylose and amylopectin contents
Extraction: A flour sample (0.1 g) was added to a tube containing 5 mL of 1 N KOH. After homogenization, this mixture was neutralized by adding 5 mL of 1 N HCL solution and then boiled for 15 min. After cooling, the mixture was centrifuged at 4000 rpm for 5 min, and the supernatant was recovered for total starch, amylose and amylopectin quantification
| [17] | Subroto E, Jeanette G, Meiyanasari Y, Luwinsky I, Baraddiaz S. Review on the Analysis Methods of Starch, Amylose, Amylopectinin Food and Agricultural Products. Int J Emerg Trends Eng Res. 2020; 8(7): 3519–24. https://doi.org/10.30534/ijeter/2020/103872020 |
[17]
.
Dosage: A volume of 100 µL of extract, 5 mL of distilled water and 50 µL of lugol were added in sequence to a test tube. The mixture was homogenized and incubated for 5 min at room temperature. The absorbances were read with a spectrophotometer (Thermo Fischer Biomate 3S, Madison, WI53711, USA) at 580 nm for total starch and at 720 nm for amylopectin. A standard starch solution was used to establish the calibration curve. The contents of total starch and amylopectin were deduced from linear regression equations, whereas that of amylose was deduced by differential calculation according to the following equation.
Amylose(%)=starch(%)–amylopectin(%)(11)
(iv). Energy Value
Atwater coefficients was employed to determine the energy value
| [18] | Merrill AL, Watt BK. Energy value of foods: Basis and derivation. Hum Nutr Res Branch, Agric Res Serv US Dep Agric Handbook; 74p. 1955. |
[18]
.
Energy(Kcal/100gDM)=[(%proteins×4kcal)+(%carbohydrates×4kcal)+(%lipids×9kcal)+(%fibers×2kcal)](12)
(v). Mineral Contents
Iron (Fe)
The spectrophotometric method based on orthophenanthroline reagent was employed to assess the iron levels. A 50 mL volume of aqueous sample extract was mixed with 1 mL of hydroxylamine chloride solution, 2 mL of acetate buffer solution and 2 mL of phenanthroline solution. After incubation for 15 min, the absorbances were read with a spectrophotometer (ONDA V-10 plus) at 510 nm. A linear regression equation, established with a standard solution, was used to calculate the ferrous ion content.
Phosphates (P)
A volume of 40 mL of sample extract was introduced into a flask. To this mixture, 4 mL of ammonium molybdate reagent and a spatula tip of ascorbic acid were added before boiling. After cooling, the solution was read with a spectrophotometer (ONDA V-10 plus) at 610 nm. A linear regression equation established with a standard solution was used to calculate the phosphate content.
Potassium (K), calcium (Ca), and magnesium (Mg)
High-performance liquid chromatography (HPLC: 881 Compact IC Pro) was used for the determination of the following minerals: calcium (Ca), magnesium (Mg), and potassium (K).
For each mineral element, a calibration range (10 - 100 mg/L) was established from the standards.
One gram of ground sample was diluted in a 250 mL flask with 5 mL of 0.01 mol/L nitric acid (pH 2 to 2.5). A volume of 2 mL was withdrawn and filtered through a 0.45 µm diameter filter. After shaking, 2 mL of the appropriate dilution for each sample was injected into the chromatograph. The concentrations of K, Ca and Mg were deduced from the linear regression equations derived from the calibration curves previously established
| [19] | Ahmad MA, Deng X, Adeel M, Rizwan M, Shakoor N, Yang Y, Javed R. Influence of calcium and magnesium elimination on plant biomass and secondary metabolites of Stevia rebaudiana Bertoni. Biotechnology and Applied Biochemistry. 2022; 69(5): 2008-2016. https://doi.org/10.1002/bab.2263 |
[19]
.
(vi). Antinutritional Factors (ANFs) Levels
Antinutritional factors (ANFs), also known as antinutrients, can be classified into two major groups. One group consists of proteins (such as lectins, cyanogenic glycosides and protease inhibitors), which are sensitive to normal processing temperatures (heat-labile), and the second consists of other substances that are stable or resistant to these temperatures (heat-stable), including many other polyphenolic compounds (mainly condensed tannins, phytic acids), nonprotein amino acids and galactomannan gums
.
In this work, lectins (heat-labile ANFs) and condensed tannins (heat-stable ANFs) were chosen to determine their levels in our samples spectrophotometrically via the Folin–Ciocalteu reagent.
Condensed tannins
Extraction: For extraction of tannins, a mixture consisting of 0.1 g of plant material dissolved in 20 mL of acetone-water (7:3; v/v) was placed in an ultrasonic bath for 10 min. The mixture was then filtered through filter paper. The same operation was repeated three times with the recovered pellet to maximize the extraction. The filtrates were added and concentrated via an evaporator (Buchi R-100) to remove the organic phase (acetone). The concentrated solution was recovered and saturated with sodium chloride to precipitate the tannins. After the mixture was centrifuged at 3500 rpm for 10 min, the pellet was recovered and dissolved in 2 mL of distilled water
| [21] | Sambe M, Tounkara LS, Lopy MJFS, Diaye YN. Etude des comportements rhéologiques des mélanges de farine blé / sorgho sans tanins issue de trois nouvelles variétés cultivées au Sénégal et mise au point de pains a base de farines. Agronomie africaine. 2017; 29(1): 69–74. |
[21]
.
Dosage: To 1 mL of extract, 1 mL of distilled water, 200 µL of ethanol or 100 µL of concentrated Folin-Ciocalteu reagent was added. After homogenization, the mixture was incubated for 5 min at room temperature (25–30°C). Afterward, 200 µL of 7% ammonium carbonate was added. After incubation in the dark for 1 h, the absorbances were read at 725 nm via a spectrophotometer (Thermo Fischer Biomate 3S, Madison, WI53711, USA)
| [22] | Koutouan F, Yapi Y, Wandan E, Clément N, Phillipe K. Composition en polyphénols totaux et en tanins des feuilles de neuf variétés de Cajanus cajan (L.) Millsp. au cours du premier cycle de croissance et en fonction du mode d’exploitation. Int J Biol Chemecial Sci. 2019; 13(2): 882–898. https://doi.org/10.4314/ijbcs.v13i2.25 |
[22]
.
Lectins
Extraction: One gram (1 g) of sample dissolved in 10 mL of distilled water was homogenized for 5 min and then placed in an ultrasonic bath (Elma S15) for 10 min. After centrifugation at 4000 rpm for 10 min, the supernatant was collected for lectin quantification.
Dosage: In a tube containing 1.9 mL of physiological water, 100 µL of extract was added, and the mixture was incubated for 10 min at room temperature. Then, 100 µL of Folin-Ciocalteu reagent and 1 mL of working solution (mixture of 2% Na
2CO
3 solution in 0.1 N NaOH (W/V), 1% CuSO
4 solution in distilled water (W/V) and 2.4% Na-K double tartrate solution in distilled water (W/V)) were added. After 60 min of incubation in the dark, the absorbances were read at 750 nm via a spectrophotometer (Thermo Fischer Biomate 3S, Madison, WI53711, USA)
| [23] | Aragão KS. Etudes structure-fonction de lectines (DiscI et DiscII) de Dictyostelium discoideum. Thèse de Doctorat, 124p., Ecole Doctorale Chimie et Sciences du Vivant, Université Joseph Fourier Grenoble, Grenoble, France; 2008. |
[23]
.
2.2.3. Determination of Technological Properties
(i). Grinding Yield
Ten grams (10 g) of cereal grain were ground using a grinder (Floria ZLN308G, power 200 W; 50/60 Hz). The obtained powder was collected and weighed. The grinding yield was obtained by the following formula:
Grindingyield(%)=x100(13)
(ii). Water Absorption Capacity (WAC) and Water Solubility Index (WSI)
In a centrifuge tube of known initial weight (M0), 1 g of flour was mixed with 10 mL of distilled water. The mixture was kept in a water bath at 37°C for 30 min and then centrifuged at 4000 rpm for 10 min before recovering and reweighing the wet pellet (M1). The pellet was oven-dried at 105°C to a constant weight (M2)
| [9] | Patekar S, More D, Hashmi S. Studies on physico-chemical properties and minerals content from different sorghum genotypes. J Pharmacogn Phytochem. 2017; 6(5): 600–4. |
[9]
.
The WAC was calculated via the following formula:
x100(14)
M1: mass of wet power before oven drying (g)
M2: mass of power after oven drying (g)
The water solubility index (WSI) was calculated using the method of
| [9] | Patekar S, More D, Hashmi S. Studies on physico-chemical properties and minerals content from different sorghum genotypes. J Pharmacogn Phytochem. 2017; 6(5): 600–4. |
[9]
.
(15)
(iii). Oil Absorption Capacity (OAC)
A test portion of 1 g of flour was dispersed in 10 mL of oil. After shaking for 30 min, followed by centrifugation at 4000 RPM for 10 min, the pellet was recovered and weighed.
The OAC is obtained using the following equation:
x100(16)
(iv). Hydrophilic-lipophilic (HL) Ratio
The hydrophilic‒lipophilic ratio was used to evaluate the comparative affinity of the flours for water and oil. It corresponds to the ratio of the water absorption capacity (WAC) to the oil absorption capacity (OAC), which is estimated according to the following equation:
x100(17)
(v). Fibers
One gram (1 g) of flour was boiled in 50 mL of 0.25 N sulfuric acid (H
2SO
4). The residue was then boiled in 50 mL of 0.31 N sodium hydroxide for 1 h. The residue obtained was dried at 105°C in the oven for 8 h and then incinerated at 550°C for 3 h. The ash was weighed to determine the fiber content
via the following formula
| [24] | Pinta M. Méthodes de référence pour la détermination des éléments minéraux dans les végétaux: 1. azote, phosphore, potassium, sodium, calcium, magnésium par les laboratoires membres du comité inter-instituts d’étude des techniques analytiques du diagnostic foliaire. IIe Coll. Eur. Méed. Contrôle Alim. Plantes Cult., 2., Séville (ES), 1968/09. fdi: 16085; 1968. |
[24]
.
x100(18)
2.2.4. Data Analysis
The data were analyzed using Minitab software 18.1. Analysis of variance (ANOVA) using the Fischer test was used to compare the means at a threshold of 0.05.
3. Results
3.1. Physicochemical Characteristics
To assess the physicochemical characteristics of our sorghum samples, shape, size and color were observed. The pH, humidity, dry matter, free acidity and total ash contents were determined.
3.1.1. Physical Characteristics
The results of physical characteristics such as color, form and size of grains are shown in
Table 2 below.
The grains of the three sorghum varieties “
Duguyiriwa”, “Jakumbe” and “
Seguifa” were brown‒white, whereas those of the “
Kenikedje” variety were white. All these grains had the same form (spherical or ovoid) and the same size (3.33±0.57–3.50±0.50 mm). The weight of the 1000 grains varied among the varieties (p value = 0.0026E-2 < 0.05) from 16.13±0.22 to 23.93±1.04 g (
Table 2).
Table 2. Physical characteristics of sorghum grains. Physical characteristics of sorghum grains. Physical characteristics of sorghum grains.
Varieties of sorghum | Color | Form | Size (mm) | Weight of 1000 grains (g) |
Duguyiriwa | Brown-white | Spheric | 3.50±0.50a | 22.20±0.73b |
Jakumbe | Brown-white | Spheric | 3.50±0.50 a | 23.93±1.04a |
Kenikedje | White | Spheric | 3.33±0.57 a | 16.13±0.22c |
Seguifa | Brown-white | Spheric | 3.50±0.50 a | 22.49±1.25ab |
3.1.2. Chemical Characteristics
The characterization results are shown in
Table 3.
Table 3. Chemical characteristics of sorghum grains.
Samples | Humidity (%) | Dry matter (%) | Total ashes (%) | Free acidity (° Dornic) |
Duguyiriwa | 8.49±0.20a | 91.50±0.20c | 1.93±0.11a | 0.05±0.00b |
Jakumbe | 7.28±0.09c | 92.71±0.09a | 1.45±0.10b | 0.04±0.00b |
Kenikedje | 7.66±0.27bc | 92.33±0.27ab | 0.68±0.05c | 0.04±0.00b |
Seguifa | 8.07±0.31ab | 91.93±0.31bc | 1.78±0.04a | 0.06±0.00a |
P-value | 0.0014 | 0.0014 | 0.0000003 | 0.00002 |
All the chemical parameters were found to be statistically significant (p value < 0.05). All the grain samples of the four sorghum varieties were very slightly acidic (< 0.10 ° Dornic). Low levels of humidity (7.28±0.09 to 8.49±0.20%) were detected in all the grains, with the highest values observed in the Duguyiriwa and Seguifa varieties. In contrast, these grains were rich in dry matter ranging from 91.50±0.20 to 92.71±0.09%. The highest total ash contents were recorded in the Duguyiriwa (1.93±0.11%) and Seguifa (1.78±0.04%) samples, whereas the lowest level was observed in the Kenikedje variety (0.68±0.05%).
3.2. Nutritional Composition
3.2.1. Macronutrients Levels
The macronutrient (total protein, carbohydrate, and fat) contents in addition to the fiber and caloric value contents of the samples are summarized in
Table 4.
Table 4. Levels of macronutrients of sorghum varieties.
Varieties | Proteins (%) | Fats (%) | Carbohydrates (%) | Crude fibers (%) | Energy power (kcal/100 g) |
Duguyiriwa | 5.32±0.42b | 3.32±0.28b | 80.94±0.80ab | 2.84±0.25a | 380.59±1.43c |
Jakumbe | 5.57±0.08b | 5.80±0.26a | 79.90±0.41c | 2.83±0.43a | 399.72±1.57a |
Kenikedje | 6.42±0.36a | 3.56±0.33b | 81.67±0.38a | 2.46±0.23a | 389.36±1.84b |
Seguifa | 6.38±0.45a | 3.65±0.30b | 80.12±0.48bc | 2.45±0.36a | 383.77±2.53c |
P-value | 0.0110 | 0.0022E-2 | 0.0144 | 0.3419 | 0.0008-E2 |
DRV (g) | 50 | 78 | 275 | 28 | |
DRV: Daily reference values based on the reference caloric intake of 2,000 calories for adults and children aged 4 years and older
| [25] | FDA. Food and Drug Administration (FDA). Food Labeling: Revision of the Nutrition and Supplement Facts Labels. Department of Health and Human Services; 21 CFR Part 101; [Docket No. FDA-2012-N-1210]; RIN 0910-AF22; 943p. Available on https://s3.amazonaws.com/pu. 2016 |
[25]
.
A part of fibers contents, all estimated parameters have statistically varied from one sample to another (p-value < 0.05). Samples were strongly rich in total carbohydrates with levels varied from 79.90±0.41% for
Jakumbe sample to 81.67±0.38% for
Kenikedje sample (
Figure 2).
Kenikedje variety with 6.42±0.36 % and
Seguifa variety with 6.38±0.45% exhibited the highest number of proteins. These investigated sorghum samples were fairly rich in calory (380.59±1.43 - 399.72±1.57
kcal/100 g) and low in fats with a maximum of 5.80±0.26 % for
Jakumbe sample.
3.2.2. Amino Acid Profile
The chromatographic profile of the amino acids obtained from the TLC plate is shown in
Table 5 below.
Table 5. Amino acid profile.
Samples | Ala | Cys | Glu | Gly | Lys | Leu | Met | Arg | Tyr |
Duguyiriwa | + | + | + | + | + | + | + | + | + |
Jakumbe | + | + | + | - | + | + | + | + | + |
Kenikedje | + | + | + | - | - | + | + | + | + |
Seguifa | + | + | + | + | + | + | + | + | + |
Among the 9 investigated available amino acids, 7 were identified in all varieties of sorghum: cysteine, glutamic acid, lysine, leucine, methionine, arginine, and tyrosine. Among the amino acids characterized, three were essential (methionine, leucine and lysine), and one was semi-essential (arginine). The “
Kenikedje” sorghum lacked the amino acids lysine, glutamic acid and alanine.
Table 5 shows the absence of lysine (an essential amino acid) in only the
Kenikedje variety of sorghum.
3.2.3. Mineral Contents
Five minerals were assessed in the samples and their contents are shown in
Table 6.
Table 6. Mineral contents of the different varieties.
Varieties | Calcium (g/100 g) | Potassium (g/100 g) | Phosphorus (g/100 g) | Magnesium (g/100 g) | Iron (mg/100 g) |
Duguyiriwa | 0.46±0.08a | 2.71±0.28b | 2.70±0.01a | 0.85±0.06c | 1.58±0.02a |
Jakumbe | 0.38±0.01a | 1.33±0.03c | 0.67±0.04c | 1.04±0.03a | 1.37±0.03b |
Kenikedje | 0.37±0.01a | 1.40±0.05c | 1.53±0.42b | 1.01±0.03ab | 1.05±0.11c |
Seguifa | 0.45±0.07a | 3.49±0.02a | 2.91±0.01a | 0.96±0.05b | 1.55±0.02a |
P-Value | 0.1426 | 0.0015E-4 | 0.0004E-2 | 0.0031 | 0.0014E-2 |
RDI (g) | 1.30 | 4.70 | 1.25 | 0.42 | 0.018 |
RDI: Reference Daily Intakes recommendations for adults and children ≥ 4 years
| [25] | FDA. Food and Drug Administration (FDA). Food Labeling: Revision of the Nutrition and Supplement Facts Labels. Department of Health and Human Services; 21 CFR Part 101; [Docket No. FDA-2012-N-1210]; RIN 0910-AF22; 943p. Available on https://s3.amazonaws.com/pu. 2016 |
[25]
.
Overall, all the mineral levels were significantly different (p value < 0.05), with the exception of the calcium (Ca
2+) level (p value = 0.1426 > 0.05). Daily interesting amounts of phosphorus (values > RDI = 1.25 g) and magnesium (values > RDI = 0.42 g) were recorded, with all samples being a part of
Jakumbe for phosphorus. Substantial levels of calcium (0.37±0.01–0.46±0.08 g/100 g), potassium (1.33±0.03–3.49±0.02 g/100 g), and iron (1.05±0.11–1.58±0.02 g/100 g) were noted (
Table 6).
3.2.4. Antinutritional Factors (ANFs)
The level of antinutritional factors such as tannins and lectins are depicted in the
Figure 1.
The data in
Figure 1 show that all the samples were very poor in antinutritional elements, and these amounts were sample dependent (p value < 0.05). The concentrations of ANFs varied from 2.97±0.13 to 0.64±0.07 mg equivalent SAB/100 × g for lectins and from 0.06±00 mg to 0.16±0.00 equivalent AG/100 × g for tannins.
Figure 1. Levels of antinutritional factors (lectins and tannins).
3.3. Technological Properties
The grinding yield, crude fiber content, water absorption capacity (WAC), oil absorption capacity (OAC), water solubility index (WSI), and hydrophilic–Lyophilic ratio (HL) were evaluated to determine their technological properties (
Table 7).
Figure 2 shows the results of the quantitative and qualitative analyses of starch.
Table 7. Technological characteristics.
Varieties | Grinding yield (%) | WSI | WAC (%) | OAC (%) | HL Ratio |
Duguyiriwa | 94.74±0.42a | 0.35±0.03a | 74.37±1.44a | 8.97±0.05b | 8.29±0.21a |
Jakumbe | 95.80±1.31a | 0.26±0.03b | 67.20±0.95b | 10.76±0.67a | 6.26±0.33c |
Kenikedje | 92.47±2.40a | 0.22±0.02bc | 67.68±2.13b | 9.00±0.00b | 7.52±0.24b |
Seguifa | 94.80±1.31a | 0.19±0.01c | 69.10±1.65b | 10.50±0.50a | 6.59±0.44c |
p-value | 0.129 | 0.0005 | 0.002 | 0.001 | 0.0002 |
WSI: water solubility index; WAC: water absorption capacity; OAC: water absorption capacity; HL ratio: hydrophilic‒lipophilic ratio.
Figure 2. Amounts of starch, amylopectin and amylose per sample.
Except the grinding yield, the technological parameters significantly differed among the varieties. The data in
Table 7 show that all four types of sorghum were highly skilled at transformation processes, with high grinding yields ranging from 92.47±2.40 to 95.80±1.31%. Globally, Duguyiriwa presented the best technological parameters, i.e., the highest water solubility index (WSI = 0.35±0.03), water absorption capacity (WAC = 74.37±1.44%) and HL ratio (8.29±0.21).
As shown in the
Figure 2, high contents of total starch were detected in the samples, with
Duguyiriwa presenting the greatest importance value (77.66±0.22%) and
Kenikedje the lowest value (49.98±1.08%). In contrast, the
Kenikedje variety could be considered as the best quality among these varieties, regarding to its strongest level of amylose (29.52±1.03%), followed by
Duguyiriwa, with 20.20±2.75% amylose; Seguifa, with 19.26±1.70%; and Jakumbe, with 18.76±0.38% amylose (
Figure 2).
4. Discussion
4.1. Physicochemical Characteristics
The current work aimed to investigate the physicochemical, nutritional, antinutritional and technological properties of four sorghum varieties (‘Duguyiriwa”, “Jakumbe”, “Seguifa”, and “Kenikedje”).
Physicochemical parameters play a crucial role in determining the quality of sorghum grains. In particular, physical characteristics are among the most important commercial criteria that can condition the selection and purchase of grain by agri-food professionals to address the increasingly pressing needs of their customers, particularly urban consumers
| [26] | Songre-Ouattara LT, Bationo F, Parkouda C, Dao A, Henri I, Bassole N, et al. Qualité des grains et aptitude à la transformation : cas des variétés de Sorghum bicolor, Pennisetumg laucum et Zea mays en usage en Afrique de l’Ouest. Int J Biol Chem Sci. 2015; 9(6): 2819–32. https://doi.org/10.4314/ijbcs.v9i6.23 |
[26]
. The individual sorghum grains exhibited a consistent spherical shape but varied in color, ranging from brown to white. These physical features affect end product quality
| [9] | Patekar S, More D, Hashmi S. Studies on physico-chemical properties and minerals content from different sorghum genotypes. J Pharmacogn Phytochem. 2017; 6(5): 600–4. |
[9]
and represent a major criteria for farmers when selecting a sorghum variety
| [27] | Sissoko S, Diallo AG, Niaba T, Coulibaly SB, Coulibaly MM, Vernon G, et al. Farmers’ Varietal preferences, implications in improvement of Sorghum (Sorghum bicolor (L) Moench) and productivity in Mali. J Agric Food Technol. 2016; 6(3): 1–11. |
[27]
. The average sizes of 1000 grains (3.33–3.50 mm) were statistically the same for all varieties (p value > 0.05). In contrast, the weight of 1000 grains varied significantly from 23.93±1.04 g for the
Jakumbe sample to 16.13±0.22 g for the
Kenikedje sample. These values are considerably lower than those reported by Patekar et al.
| [9] | Patekar S, More D, Hashmi S. Studies on physico-chemical properties and minerals content from different sorghum genotypes. J Pharmacogn Phytochem. 2017; 6(5): 600–4. |
[9]
with other cultivars of sorghum (33.10 to 34.30 g). These data revealed that the three sorghum varieties (
Duguyiriwa, Jakumbe and Seguifa) presented significantly greater weights, suggesting higher productivity rate compared to the
Kenikedje cultivar. These findings are consistent with studies that demonstrate varietal innovation or improvement enhances agricultural productivity
| [8] | Maiga AM, Diallo AG, Kane Y. Adaptation of bio-fortified Sorghum hybrids (Sorghum bicolor) to drought resilience in Mali. Int J Agric Environ Bioresearch. 2023; 08(05): 1–12. https://doi.org/10.35410/IJAEB.2023.5858 |
| [27] | Sissoko S, Diallo AG, Niaba T, Coulibaly SB, Coulibaly MM, Vernon G, et al. Farmers’ Varietal preferences, implications in improvement of Sorghum (Sorghum bicolor (L) Moench) and productivity in Mali. J Agric Food Technol. 2016; 6(3): 1–11. |
[8, 27]
, thereby contributing to the food security and increasing small farmers’ incomes
| [6] | Sissoko M, Smale M, Castiaux A, Theriault V. Adoption of new sorghum varieties in Mali through a participatory approach. Sustainability. 2019; 11(4780): 1–15. https://doi.org/10.3390/su11174780 |
[6]
. Numerous factors, such as genotypic, meteorological factors, poor rainfall and lack of training of farmers, methods of farming and seeding periods are incriminated to influence this variation
| [2] | Almamy S, Jummai OY, Sekou T. The choice and preference of sorghum value chain actors in Mali. Int J Sociol Anthropol. 2023; 15(1): 41–58. https://doi.org/10.5897/ijsa2021.0930 |
| [9] | Patekar S, More D, Hashmi S. Studies on physico-chemical properties and minerals content from different sorghum genotypes. J Pharmacogn Phytochem. 2017; 6(5): 600–4. |
| [27] | Sissoko S, Diallo AG, Niaba T, Coulibaly SB, Coulibaly MM, Vernon G, et al. Farmers’ Varietal preferences, implications in improvement of Sorghum (Sorghum bicolor (L) Moench) and productivity in Mali. J Agric Food Technol. 2016; 6(3): 1–11. |
[2, 9, 27]
.
The titratable acidity assessment is an important parameter in the quality control of cereal, control of cereal, as it reflects microbial activity. Our data revealed that all the tested cultivars presented lower acidity values ranging from 0.04 to 0.06 °Dornic (i.e., pH << 7). These findings support those reported in the literature. For example, Chantereau et al.
| [28] | Chantereau J, Cruz JF, Ratnadass A, Trouche G. Le sorgho.,. Rapport de Quæ, CTA, Presses agronomiques de Gembloux, 261p., Dedougou, Burkina Faso; 2013. |
[28]
reported an acidity of 0.09% with sorghum grains, and Jocelyne et al.
| [29] | Jocelyne RE, Béhiblo K, Ernest AK. Comparative Study of Nutritional Value of Wheat, Maize, Sorghum, Millet, and Fonio: Some Cereals Commonly Consumed in Côte d’Ivoire. Eur Sci J. 2020; 16(21): 118–31. https://doi.org/10.19044/esj.2020.v16n21p118 |
[29]
reported 3.97 mEq/100 g DM with white sorghum (
Kenikedje variety). This low acidity is unsuitable for yeast and mold growth
| [30] | Doukani K, Tabak S. Profil Physicochimique du fruit “Lendj” (Arbutus unedo L.). Rev Nat Technol. 2015; 12: 53–66. |
[30]
.
The moisture and total ash contents were varietal dependent and ranged from 7.28 to 8.49% and 0.68 to 1.93%, respectively. These results were similar to those of other sorghum varieties, where the mean values varied from 8.2 to 7.0% for moisture and from 1.15 to 1.45% for total ashes
| [9] | Patekar S, More D, Hashmi S. Studies on physico-chemical properties and minerals content from different sorghum genotypes. J Pharmacogn Phytochem. 2017; 6(5): 600–4. |
[9]
. Higher moisture (11.57%) and ash (4.16%) contents were found in other studies carried out on the
Kenikedje cultivar
| [29] | Jocelyne RE, Béhiblo K, Ernest AK. Comparative Study of Nutritional Value of Wheat, Maize, Sorghum, Millet, and Fonio: Some Cereals Commonly Consumed in Côte d’Ivoire. Eur Sci J. 2020; 16(21): 118–31. https://doi.org/10.19044/esj.2020.v16n21p118 |
[29]
. Currently, moisture content is one of the fundamental metrics by which the grain industry operates. Moisture levels impact facility design and operations, as well as the marketing of grain products. In this context, it has been suggested that reducing moisture content is crucial to extending the shelf-life of foodstuffs
. The moisture content is defined as the weight lost by a substance until a constant weight is reached; under such conditions, this substance does not undergo any detectable alteration other than the reversible loss of moisture
. On the basis of this definition, a lower moisture content (< 10%) is recommended for better conservation.
4.2. Nutritional Characteristics
With respect to population growth coupled with climate change, there is a pressing need to innovate or improve sorghum varieties that are both more productive and resistant to pests and diseases
| [5] | Smale M, Kergna A, Diakite L. An economic assessment of sorghum improvement in Mali. Impact Assessment Report No. 2. Patancheru 502 324, Telangana, India Int Crop Res Inst Semi-Arid Trop. 2016; 1–52. |
| [6] | Sissoko M, Smale M, Castiaux A, Theriault V. Adoption of new sorghum varieties in Mali through a participatory approach. Sustainability. 2019; 11(4780): 1–15. https://doi.org/10.3390/su11174780 |
[5, 6]
. For instance, approximately 30% of the sorghum zone has been planted with improved varieties since the mid-1990s
| [4] | Kelly V, Diakité L, Teme B. Sorghum Productivity in Mali: Past, Present, and Future. MSU International Development Working Paper. Dep Agric Food, Resour Econ Dep Econ Michigan State Univ East Lansing, Michigan 48824-1039, USA [Internet]. 2015; Available from: file:///F:/Spec2/TrafficDelay Model.pdf |
[4]
. However, it is also important that these varieties possess high nutritional quality. For this reason, this work also focused on assessing the nutritional composition of the four sorghum cultivars through their various biochemical parameters, such as carbohydrates, proteins, fibers, fats, and minerals. Additionally, starch and protein qualitative and quantitative composition analyses were carried out. Overall, the nutritional parameters were significantly variable (p value < 0.05). The total carbohydrate and protein contents of the different sorghum varieties ranged from 81.67% to 79.90% and from 5.32% to 6.42%, respectively. These results are consistent with previous studies; Patekar et al.
| [9] | Patekar S, More D, Hashmi S. Studies on physico-chemical properties and minerals content from different sorghum genotypes. J Pharmacogn Phytochem. 2017; 6(5): 600–4. |
[9]
reported mean values of 72.77%, and Songre-Ouattara et al.
| [26] | Songre-Ouattara LT, Bationo F, Parkouda C, Dao A, Henri I, Bassole N, et al. Qualité des grains et aptitude à la transformation : cas des variétés de Sorghum bicolor, Pennisetumg laucum et Zea mays en usage en Afrique de l’Ouest. Int J Biol Chem Sci. 2015; 9(6): 2819–32. https://doi.org/10.4314/ijbcs.v9i6.23 |
[26]
reported values of 74.4% for carbohydrates. Nonetheless, the protein levels reported in our samples were inferior to those reported by the same authors: 10.43% for Patekar et al.
| [9] | Patekar S, More D, Hashmi S. Studies on physico-chemical properties and minerals content from different sorghum genotypes. J Pharmacogn Phytochem. 2017; 6(5): 600–4. |
[9]
and 10.8% for Songre-Ouattara et al.
| [26] | Songre-Ouattara LT, Bationo F, Parkouda C, Dao A, Henri I, Bassole N, et al. Qualité des grains et aptitude à la transformation : cas des variétés de Sorghum bicolor, Pennisetumg laucum et Zea mays en usage en Afrique de l’Ouest. Int J Biol Chem Sci. 2015; 9(6): 2819–32. https://doi.org/10.4314/ijbcs.v9i6.23 |
[26]
. Many factors, including genetics, environmental factors, and farming practices, contributed to the variation in the biochemical composition of cereals
| [26] | Songre-Ouattara LT, Bationo F, Parkouda C, Dao A, Henri I, Bassole N, et al. Qualité des grains et aptitude à la transformation : cas des variétés de Sorghum bicolor, Pennisetumg laucum et Zea mays en usage en Afrique de l’Ouest. Int J Biol Chem Sci. 2015; 9(6): 2819–32. https://doi.org/10.4314/ijbcs.v9i6.23 |
| [29] | Jocelyne RE, Béhiblo K, Ernest AK. Comparative Study of Nutritional Value of Wheat, Maize, Sorghum, Millet, and Fonio: Some Cereals Commonly Consumed in Côte d’Ivoire. Eur Sci J. 2020; 16(21): 118–31. https://doi.org/10.19044/esj.2020.v16n21p118 |
[26, 29]
. This richness in protein and carbohydrates could be useful for fighting protein-energy malnutrition in Mali, where 27% of children under 5 years of age are chronically malnourished
| [32] | EDSM-VI. Institut National de la Statistique (INSTAT), Cellule de Planification et de Statistique, Secteur Santé-Développement Social et Promotion de la Famille (CPS/SS-DS-PF), et ICF. Sixième Enquête Démographique et de Santé au Mali 2018. Indicateurs Clés. Bamako, Mali, et Rockville, Maryland, USA : INSTAT, CPS/SS-DS-PF, et ICF.; 2019. |
[32]
.
This work focused on the determination of the qualitative profile of amino acids, since cereals are known to have an unbalanced amino acid composition, which is essential for limiting amino acids, particularly lysine. Nutrition based on a high consumption of cereals and a low supply of protein must be considered risky
| [33] | Smith J, Sones K, Grace D, MacMillan S, Tarawali S, Herrero M. Beyond milk, meat, and eggs: Role of livestock in food and nutrition security. Anim Front. 2013; 3(1): 6–13. https://doi.org/10.2527/af.2013-0002 |
[33]
. Our results revealed the presence in lysine in three improved sorghum varieties (
Duguyiriwa, Jakumbe and
Seguifa), whereas it was absent in the
Kenikedje variety. Previous studies reported that
Duguyiriwa | [8] | Maiga AM, Diallo AG, Kane Y. Adaptation of bio-fortified Sorghum hybrids (Sorghum bicolor) to drought resilience in Mali. Int J Agric Environ Bioresearch. 2023; 08(05): 1–12. https://doi.org/10.35410/IJAEB.2023.5858 |
[8]
and
Seguifa | [7] | Maiga AM, Nebie B, Diallo AG, Toure A, Danquah E, Danquah A. Yield, Yield Components and Nutritional Traits Values of Biofortified Sorghum Hybrids in Mali.pdf. J Agric Stud. 2021; 10(1): 1–28. https://doi.org/10.5296/jas.v10i1.19055 |
[7]
produce 1.97 mg/100 g and 3.19 mg/100 g of lysine, respectively. These findings emphasized the importance of improvement in cereal through their enrichment in essential amino acid molecules.
In general, cereal grains are low in lipids because these molecules are concentrated mainly in the germ
| [26] | Songre-Ouattara LT, Bationo F, Parkouda C, Dao A, Henri I, Bassole N, et al. Qualité des grains et aptitude à la transformation : cas des variétés de Sorghum bicolor, Pennisetumg laucum et Zea mays en usage en Afrique de l’Ouest. Int J Biol Chem Sci. 2015; 9(6): 2819–32. https://doi.org/10.4314/ijbcs.v9i6.23 |
| [29] | Jocelyne RE, Béhiblo K, Ernest AK. Comparative Study of Nutritional Value of Wheat, Maize, Sorghum, Millet, and Fonio: Some Cereals Commonly Consumed in Côte d’Ivoire. Eur Sci J. 2020; 16(21): 118–31. https://doi.org/10.19044/esj.2020.v16n21p118 |
[26, 29]
. The low percentage of lipids (3.32–5.80%) obtained from these sorghum varieties is in line with this trend, consequently making them good candidates for use in overweight, obese and diabetic patients.
The fiber contents (2.45% to 2.84%) showed no significant variation among the varieties. These values are comparable to those reported by Patekar et al.
| [9] | Patekar S, More D, Hashmi S. Studies on physico-chemical properties and minerals content from different sorghum genotypes. J Pharmacogn Phytochem. 2017; 6(5): 600–4. |
[9]
, who observed a range from 2.10% to 3.20% of fibers, and are lower than the 8.14% mentioned by Jocelyne et al.
| [29] | Jocelyne RE, Béhiblo K, Ernest AK. Comparative Study of Nutritional Value of Wheat, Maize, Sorghum, Millet, and Fonio: Some Cereals Commonly Consumed in Côte d’Ivoire. Eur Sci J. 2020; 16(21): 118–31. https://doi.org/10.19044/esj.2020.v16n21p118 |
[29]
. Owing to their various bioactive compounds, food fibers are reputed to prevent coronary diseases, gastrointestinal tract disorders, and diabetes
. Interestingly, following the norms of the Department of Health and Human Services of Food Drug and Administration (FDA), the consumption of 1000 g of these varieties could easily cover the daily reference values of fiber (RDV = 28 g) for adults and children aged over 4 years
| [25] | FDA. Food and Drug Administration (FDA). Food Labeling: Revision of the Nutrition and Supplement Facts Labels. Department of Health and Human Services; 21 CFR Part 101; [Docket No. FDA-2012-N-1210]; RIN 0910-AF22; 943p. Available on https://s3.amazonaws.com/pu. 2016 |
[25]
.
Appreciable and variable quantities of micronutrients (minerals) were detected in the studied sorghum varieties. Among the performed minerals, phosphorus was the most concentrated (0.67–2.91 g/100 g) and could easily cover the recommended daily intake (RDI = 1.25 g) for adults and children aged over 4 years
| [25] | FDA. Food and Drug Administration (FDA). Food Labeling: Revision of the Nutrition and Supplement Facts Labels. Department of Health and Human Services; 21 CFR Part 101; [Docket No. FDA-2012-N-1210]; RIN 0910-AF22; 943p. Available on https://s3.amazonaws.com/pu. 2016 |
[25]
. Higher contents of phosphorus and iron in grains were noted with
Duguyiriwa: 2.70 g/100 g and 1.58 g/100 g and
Seguifa: 2.91 g/100 g and 1.55 g/100 g, respectively. Phosphorus is a major element that compose the human body by participating in all life processes. It plays a key role in energy production (ATP molecules), which governs and controls the energy, physiological and pathological processes of the human body. Phosphorus is essential for the formation of bones and teeth
. Similarly, all sorghum grains investigated presented greater amounts of magnesium (0.85–1.04 g/100 g > RDI = 0.42 g), which is sufficient to meet daily nutritional requirements. The high level of iron in sorghum is involved in the generation of red blood cells, the improvement of blood circulation and the growth of cells; as a result, it decreases the probability of anemia. According to scientific reports concerning the prevention of anemia, sorghum contributes to reducing the risk of developing Alzheimer’s disease, since anemia is also considered a risk factor for Alzheimer’s disease in elderly individuals
| [36] | Rezaee N, Fernando WMADB, Hone E, Sohrabi HR, Johnson SK, Gunzburg S, et al. Potential of Sorghum Polyphenols to Prevent and Treat Alzheimer’s Disease: A Review Article. Front Aging Neurosci. 2021; 13(October): 1–24. https://doi.org/10.3389/fnagi.2021.729949 |
[36]
.
Notably, similar mean values of calcium (Ca) were observed for all the samples. This high level of calcium could promote bone mineralization and growth, especially in children under 18 years of age, as calcium is a key component of these physiological processes.
4.3. Technological Properties
The assessment of technological parameters is critical for optimizing the valorization of cereals in agri-food industries.
All the studied cultivars presented greater grinding yields (> 92%) without any significant variations. The water absorption capacity (WAC) is a good indicator of flour incorporation into aqueous food formulations such as sausages and pasta and bakery products. The water solubility index (WSI) of a cereal flour indicates its degree of affinity to disperse in a homogeneous solution and consequently to present good digestibility for the consumer
| [37] | Séraphin DK, Emmanuel AN, Benjamin YK, Dago G. Caracerisation Biochimique et fonctionnelle des graines de sept cultivars de voandzou [Vigna Subterranea (L.) VerDC. Fabaceae]. Eur Sci J Sept. 2015; 11(27): 288–304. |
[37]
. The
Duguyiriwa variety demonstrated the greatest capacity to absorb water (WAC = 74.37±1.44%) and was the most digestible, with the highest WSI = 0.35. These WSI data are close to those of Gampoula et al.
| [38] | Gampoula RH, Gadet Dzondo M, Moussounga JE, Diakabana P, Pambou-Tobi NPG, Tamba Sompila AWG, et al. Mise au point d’un procédé de formulation d’une farine infantile à base d’igname (Discorea cayenensis) enrichie en protéines par incorporation d’additifs alimentaires d’origine agricole et de pêche. IOSR J Biotechnol Biochem. 2020; 6(6): 24–32. https://doi.org/10.9790/264X-0606032432 |
[38]
, with WSI = 0.40, and higher than the WAC reported by Patekar et al.
| [9] | Patekar S, More D, Hashmi S. Studies on physico-chemical properties and minerals content from different sorghum genotypes. J Pharmacogn Phytochem. 2017; 6(5): 600–4. |
[9]
(33.31%) in their work. This notable water absorption ability could be explained by its higher amylopectin content (54.66%), as amylopectin's larger branched structure enhances digestibility
| [39] | Birt D, Boylston T, Hendrich S, Jane J, Hollis J, Li L, MeClelland L, Moore S, Phillips GJ, Rowling M, Schalinske K, Scott MP, Whitley EM. Resistant starch: promise for improving human health. Adv Nutr. 2013; 4(6): 587–601. https://doi.org/10.3945/an.113.004325 |
[39]
. The oil absorption capacity (OAC) is an important parameter that characterizes flavor retention capacity. The OAC values ranged from 9.00% for
Kenikedje to 10.76% for
Jakumbe.
Starch is one of the major carbohydrate constituents in food and other biological materials. It is mainly composed of amylose and amylopectin. The functional, physicochemical, and pasting properties of starch are strongly influenced by the percentages of these 2 components (amylose and amylopectin)
| [39] | Birt D, Boylston T, Hendrich S, Jane J, Hollis J, Li L, MeClelland L, Moore S, Phillips GJ, Rowling M, Schalinske K, Scott MP, Whitley EM. Resistant starch: promise for improving human health. Adv Nutr. 2013; 4(6): 587–601. https://doi.org/10.3945/an.113.004325 |
[39]
. Amylopectin, due to its branching, facilitates gelatinization and improves functional characteristics, while amylose, with fewer branches, forms crystals more easily, making it more resistant to digestion
| [17] | Subroto E, Jeanette G, Meiyanasari Y, Luwinsky I, Baraddiaz S. Review on the Analysis Methods of Starch, Amylose, Amylopectinin Food and Agricultural Products. Int J Emerg Trends Eng Res. 2020; 8(7): 3519–24. https://doi.org/10.30534/ijeter/2020/103872020 |
[17]
. In most foodstuffs, the percentage of amylose is approximately 15–30%
| [40] | Wang J, Hu P, Chen Z, Liu Q, Wei C. Progress in High-Amylose Cereal Crops through Inactivation of Starch Branching Enzymes. Front Plant Sci. 2017; 8(April): 1–10. https://doi.org/10.3389/fpls.2017.00469 |
[40]
. In addition, the amylose content is the main factor determining the quality of a cereal for consumption purposes. The amylose content in the studied sorghum varieties ranged from 18.76 for
Jakumbe to 29.52% for
Kenikedje, which are inside the expected literature trends. Importantly, these sorghum varieties could be helpful for fat substitutes, since the ability of amylose to bind water and improve food quality is well documented
| [17] | Subroto E, Jeanette G, Meiyanasari Y, Luwinsky I, Baraddiaz S. Review on the Analysis Methods of Starch, Amylose, Amylopectinin Food and Agricultural Products. Int J Emerg Trends Eng Res. 2020; 8(7): 3519–24. https://doi.org/10.30534/ijeter/2020/103872020 |
| [39] | Birt D, Boylston T, Hendrich S, Jane J, Hollis J, Li L, MeClelland L, Moore S, Phillips GJ, Rowling M, Schalinske K, Scott MP, Whitley EM. Resistant starch: promise for improving human health. Adv Nutr. 2013; 4(6): 587–601. https://doi.org/10.3945/an.113.004325 |
[17, 39]
. Furthermore, the high percentage of amylose in sorghum contributes to its slow-digestible starch properties compared to other cereals, which aids in controlling obesity by slowing glucose release and regulating food intake
| [41] | Hasek L, Phillips R, Zhang G, Kinzig K, Kim C, Powley T, et al. Dietary slowly digestible starch triggers the gut-brain axis in obese rats with accompanied reduced food intake. Mol Nutr Food Res. 2018; 62(5): 1700117. https://doi.org/10.1002/mnfr.201700117 |
[41]
.
The above results highlighted the nutritional quality of the four varieties of sorghum developed in Mali through their richness in macronutrients and micronutrients. However, it is crucial to quantify the level of antinutrient factors (ANFs), which are highly associated with deleterious effects related to the absorption of nutrients and micronutrients
| [42] | Thakur A, Sharma V, Thakur A. An overview of anti-nutritional factors in food. Int J Chem Stud. 2019; 7(1): 2472–9. |
[42]
. ANFs can inactivate nutrients, hinder digestion, or reduce the physiological utilization of metabolites from food
| [20] | Gemede HF, Ratta N. Antinutritional Factors in Plant Foods: Potential Health Benefits and Adverse Effects. Int J Nutr Food Sci. 2014; 3(4): 284–9. https://doi.org/10.11648/j.ijnfs.20140304.18 |
| [42] | Thakur A, Sharma V, Thakur A. An overview of anti-nutritional factors in food. Int J Chem Stud. 2019; 7(1): 2472–9. |
[20, 42]
. However, some antinutrients may exert beneficial health effects at low concentrations. These factors play a crucial role in determining the suitability of plant-based foods for human consumption
. The literature has grouped ANFs into two categories: heat-labile ANFs and heat-stable ANFs
. Among them, lectins and condensed tannins belonging to heat-labile and heat-stable ANFS, respectively, were quantified in our sorghum samples. All the studied sorghum samples presented acceptable levels, i.e., nonharmful levels (<0.50%) of lectins (0.64–2.97 mg/100 g) and tannins (0.07–0.13 mg/100 g). These data support those from the literature: 66.68 mg/100 g of tannins
| [29] | Jocelyne RE, Béhiblo K, Ernest AK. Comparative Study of Nutritional Value of Wheat, Maize, Sorghum, Millet, and Fonio: Some Cereals Commonly Consumed in Côte d’Ivoire. Eur Sci J. 2020; 16(21): 118–31. https://doi.org/10.19044/esj.2020.v16n21p118 |
[29]
. Because of their relatively low contents of tannins and lectins, some studies have reported their absence in a number of sorghum varieties disseminated in Mali
| [4] | Kelly V, Diakité L, Teme B. Sorghum Productivity in Mali: Past, Present, and Future. MSU International Development Working Paper. Dep Agric Food, Resour Econ Dep Econ Michigan State Univ East Lansing, Michigan 48824-1039, USA [Internet]. 2015; Available from: file:///F:/Spec2/TrafficDelay Model.pdf |
[4]
. These bioactive compounds protect plants from predation and help plant growth
| [36] | Rezaee N, Fernando WMADB, Hone E, Sohrabi HR, Johnson SK, Gunzburg S, et al. Potential of Sorghum Polyphenols to Prevent and Treat Alzheimer’s Disease: A Review Article. Front Aging Neurosci. 2021; 13(October): 1–24. https://doi.org/10.3389/fnagi.2021.729949 |
[36]
. The presence of these compounds in all varieties could explain their resistance to predatory agents in their habitat. Furthermore, lectins and tannins have attracted intense interest from researchers, particularly because of their usefulness in agriculture and medicine
. For example, evidence work highlighted that low-tannin sorghum cultivars have a feed efficiency of 95–97% for poultry
| [4] | Kelly V, Diakité L, Teme B. Sorghum Productivity in Mali: Past, Present, and Future. MSU International Development Working Paper. Dep Agric Food, Resour Econ Dep Econ Michigan State Univ East Lansing, Michigan 48824-1039, USA [Internet]. 2015; Available from: file:///F:/Spec2/TrafficDelay Model.pdf |
[4]
. Tannins contained in sorghum interact with starch and inhibit its digestion, therefore beneficially regulating blood glucose and insulin levels. The antidiabetic and hypoglycemic effects of sorghum are attributed to its tannin profile and its ability to regulate insulin sensitivity via peroxisome proliferator-activated receptor gamma
| [43] | Park J, Lee S, Chung I, Park Y. Sorghum extract exerts an anti-diabetic effect by improving insulin sensitivity via PPAR-γ in mice fed a high-fat diet. Nutr Res Pract. 2012; 6(4): 322–7. https://doi.org/10.4162/nrp.2012.6.4.322 |
[43]
. As diabetes is strongly correlated with a high risk of developing Alzheimer’s disease and hypertension
| [36] | Rezaee N, Fernando WMADB, Hone E, Sohrabi HR, Johnson SK, Gunzburg S, et al. Potential of Sorghum Polyphenols to Prevent and Treat Alzheimer’s Disease: A Review Article. Front Aging Neurosci. 2021; 13(October): 1–24. https://doi.org/10.3389/fnagi.2021.729949 |
[36]
, sorghum tannins could attenuate these pathological pathways.
Similarly, lectins are highly physiologically potent in humans. One of their most important functions is the prevention of digestive absorption of end products inside the small intestine
| [42] | Thakur A, Sharma V, Thakur A. An overview of anti-nutritional factors in food. Int J Chem Stud. 2019; 7(1): 2472–9. |
[42]
. These antidiabetic, antihypertensive and anticancer effects are well documented. Lectins enable the stabilization of blood pressure and are useful for diabetic patients. They are involved in various functions, such as mitotic division, and demolish cancerous cells. By binding to different sugar groups, lectins can help regulate glycemia
| [20] | Gemede HF, Ratta N. Antinutritional Factors in Plant Foods: Potential Health Benefits and Adverse Effects. Int J Nutr Food Sci. 2014; 3(4): 284–9. https://doi.org/10.11648/j.ijnfs.20140304.18 |
| [42] | Thakur A, Sharma V, Thakur A. An overview of anti-nutritional factors in food. Int J Chem Stud. 2019; 7(1): 2472–9. |
[20, 42]
. The lower levels of ANFs in the investigated sorghum varieties may contribute to a decreased risk of these health issues.